This tutorial shows how to create gauge-like graphics like the one shown on the bottom of this page.
Step 1:
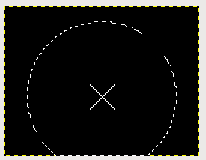
Create a blank image with black background of size 130x100 pixels.

Step 1, empty image
Step 2:
create an additional layer, name it something like center.
mark the center of your gauge with a cross or something.
This is for you to keep track of the center. This layer
will not be seen in the resulting image.
My center will be at 65,60. It is not exactly in the vertical center, but the gauge will not have a 360° display, so it perfectly fine to move the center of the gauge out of the center of the image.
Step 3, selected area
Step 4:
Now its time to draw the lines marking 10,20,30...100%.
Pick the color with the hex value #fedcc1. Use a 1x1 brush.
First we need the coordinates of the outer pixel of those lines. For those who dont want to enter the sin and cos formula into the calculator can use the following small perl script:
#!/usr/bin/perl
$maxdegree=246.0;
$startdegree=57.0;
$radius=60.0;
$centerX=65.0;
$centerY=60.0;
for ($i=0;$i<$maxdegree;$i+=$maxdegree/10)
{
  print sin(($i+$startdegree)/180.0*3.14)*$radius+$centerX," ";
  print cos(($i+$startdegree)/180.0*3.14)*$radius+$centerY,"\n";
}
Modfiy the variables at the beginning if you want to change something.
The script will produce 10 sets of coordinates, which will we will use the following way:
Go to the first coordinate pair, set a pixel.
hold down the shift key and draw a line to the center of the gauge (the cross). Only the outer pixel will be drawn.
Repeat the with the rest of the coordinates.
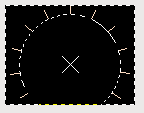
Step 4, lines drawn
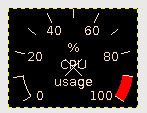
Step 6, all lines and text drawn
Step 7:
make a copy of the line layer. (this is important)
select the copy layer.
Use "Script-Fu"->"Alpha To Logo"->"Glowing Hot"
Effect Size 20 pixel, black background.
Remove the new background layer and move the line layer to to top.
Hide the layer with the cross and save as a png image.
Save it as gimp native, too. you might need that again.
To have the gauge show something, a pointer is needed.
This pointer will be created by a C program. The howto for this program will be in the C-Programming section soon.